Innovation never sleeps
The past few years have seen plenty of uncertainty. Yet through a global pandemic, geopolitical conflict, supply chain woes, and inflation, innovation keeps pushing inexorably forward.
Even as the broader economic outlook appears to be softening, the demand – and competition – for skilled tech talent has only increased.
At HackerRank, we’ve seen this firsthand. In the last five years, the number of unique candidates invited to our assessments has tripled.
Today we have over 21 million developers in our community. That’s about 40% of the world’s developers using HackerRank to build their skills, earn certifications, and find rewarding jobs.
To understand the state of developer skills heading into 2023, we’re taking a different approach with this year’s Developer Skills Report. Instead of relying on survey responses, we’re going directly to the source: our own platform data.
Using this data, we get an unbiased, unparalleled view into the programming languages and technical skills employers are looking for, and which roles and assessments drive the most engagement.
We hope you enjoy our findings.
Want to share some insights or need help? Tweet us @hackerrank or contact us on LinkedIn with comments or questions.
LANGUAGE
Measuring language demand
There’s a lot of information (and some strong opinions) about what specific programming languages developers are using. But popularity doesn’t necessarily translate to demand by employers. To determine demand in the workplace, we explored the sum of monthly active tests mandating a specific language.
Only about 1 in 5 assessments require a specific language. The remainder were left to the candidate’s preferences.
Of the 20% or so of assessments that mandated a specific programming language, we noticed a few data points of interest.

Volume is heavily concentrated in the top five languages
The top five languages by volume – Java, Python, SQL, C++, and JavaScript – dominate the list. Fifth-ranked JavaScript has nearly four times the volume of the sixth-ranked Bash.
For 2022, SQL has been growing at a steady rate and managed to surpass C++, but we’re unlikely to see any further place-trading among the top five in 2023.
We’re also unlikely to see any of the lower-ranked languages break into the top five. The volume gap is simply too great to overcome.
Most languages are growing, but not equally
In 2022, demand for most languages rose, but not equally. To get a sense of where the various languages stand in relation to each other, we indexed individual language growth against total market growth.
In terms of growth relative to the market, top-ranked Java is actually growing slightly slower than the market. As are C++ and JavaScript. Meanwhile Python and SQL demand grew. While Python’s growth may mean that it narrows the gap on Java, again, it’s unlikely to lead to any place-trading.
Go and TypeScript show impressive gains
Down the list, two newer languages caught our attention. Go and TypeScript have been gaining popularity for years, and rank 5th and 6th in the latest GitHub language rankings (Q1 2022).
Now, we’re seeing that popularity translate into hiring demand. Go assessments grew by 301% and TypeScript by a whopping 392% (or 282% compared to trend).
Their growth may also affect the growth of larger languages. TypeScript, for example, is tightly linked with JavaScript. TypeScript’s growth could come at the expense of JavaScript, or it could serve to amplify it.
Rising tide lifts *most* boats
While Go and TypeScript are booming, Swift and Ruby assessment volumes declined. For 2022, Swift’s volume is only 80% of what it was in 2021. Ruby has fallen even further behind, with a volume only 66% of what it posted in 2021.
Developers have gradually shifted away from Ruby over the past several years, and it’s not surprising to find it fading a bit more.
Swift, meanwhile, never quite caught on, and while it’s by no means dead (is any language ever truly dead?), its demand seems limited.
Developers prefer Java, Python, and C++
Mandatory language assessments reveal what languages employers are recruiting for, but they only account for about 20% of all assessments. So what about the other 80%? When developers have the freedom to choose their language, which one do they choose?
For the most part, they choose Java, Python, or C++.
Similar volume gaps appear when ranking by preference as by demand. The data reveals three distinct tiers. Java, Python, and C++ all claim well over 350,000 developers. JavaScript, C#, SQL, and C hover closer to 100-150,000 developers. And then there’s the of the rest of the range, from the 13,374 developers choosing PHP to the 1,239 braving their assessments with R.
Go and TypeScript climb, Ruby and Swift fall
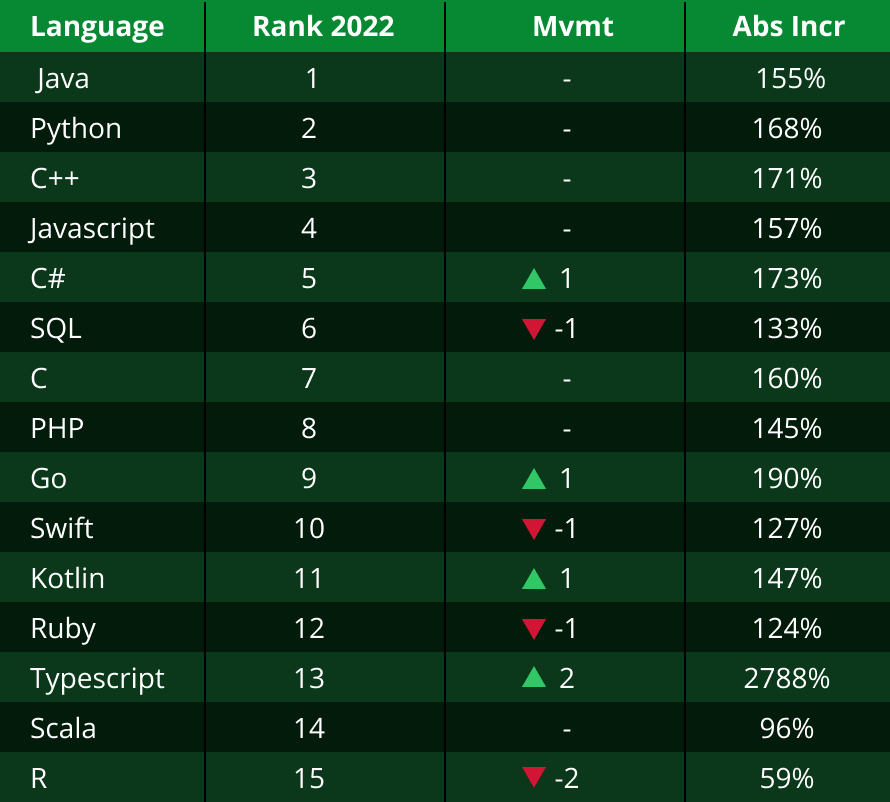
R and Scala both fell in rankings in 2022, experiencing a loss of developers.
Swift and Ruby also slipped in the rankings, reinforcing their sluggish employer demand. Both gained developers, but their growth trailed well behind the overall trend.
The two brightest spots in the long tail are, again, Go and TypeScript. Both showed big gains in developers, racking up the two highest growth rates of the entire list. Go clocked an absolute increase of 190%, and TypeScript posted a doubletake-inducing 2,788% gain.

2023 Language Forecast
What does 2023 hold for languages? Considering market uncertainty, we’re keeping our forecast conservative and sticking to the lower end of the 95% confidence interval in our models.
Overall, our forecast predicts consistency through the first months of 2023.
The languages that grew in 2021 and 2022 will continue to grow. Mostly. We expect to see a seasonal dip in December before they resume climbing.
At this point we aren’t anticipating any major place-trading among the top-ranking languages.
Java, Python, and SQL are likely to extend their lead in 2023
The top three languages of 2022 – Java, Python, and SQL – are poised to extend their lead over other languages in 2023 with a combination of higher growth and higher volume.
C++, overtaken by Python in 2020 and SQL in 2022, will likely maintain consistent, slightly slower growth. It won’t overtake SQL, but it won’t be overtaken in turn.
JavaScript demand has stayed comparatively steady since early 2021. Some of that may be due to TypeScript, which is built on top of JavaScript. Its growing adoption may mean JavaScript’s growth isn’t lagging so much as it is being dispersed.
Skills
What skills are in demand?
Every year a stream of reports claim to have the answers. Maybe they’re taken from survey data. Or cobbled from job listings. Whatever the case, they’re often a bit on the general side. If you’re already working in tech, or hiring in tech, is it really all that useful to know that “coding” or “cloud” are in demand?
To get a sense of which technical skills employers are actively looking for, we turned to our platform data, and specifically to mandatory skills tests.
These assessments test for specific skills, which in our definition involve a combination of frameworks and more discipline-level skillsets. For example, .NET and Data Visualization.

Problem Solving and Machine Learning dominate skills demand
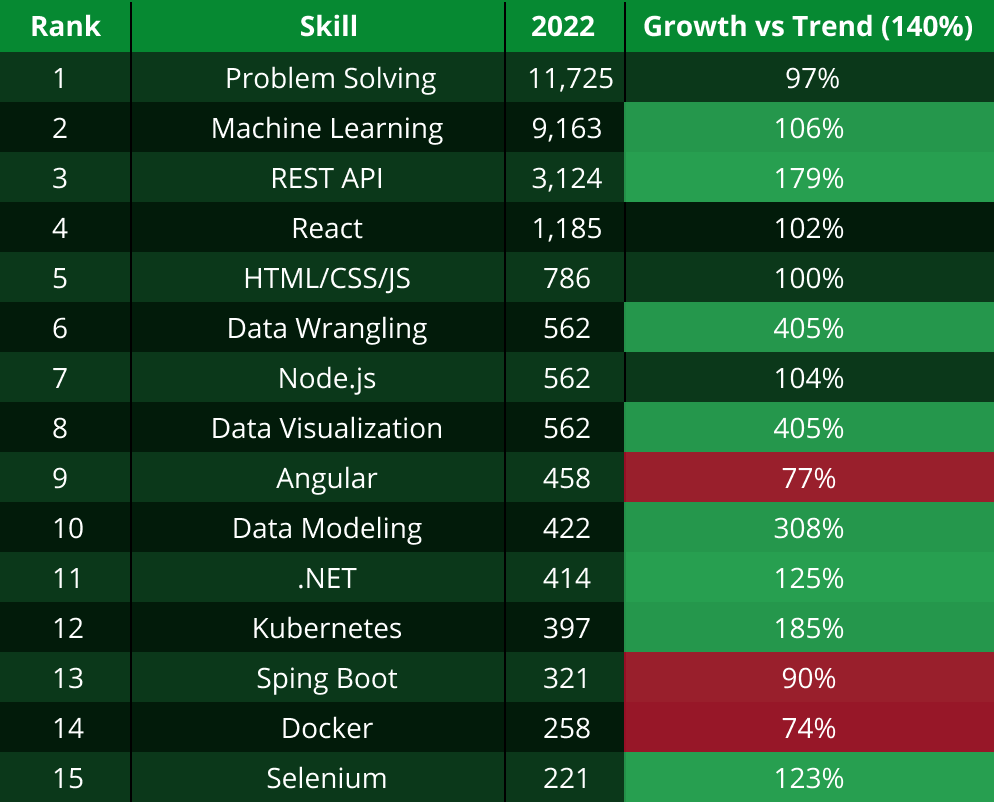
Problem Solving is the most popular skill by demand, by a healthy margin. It is also more foundational. It’s about understanding data structures and algorithms, so it’s not surprising to see it up top. Think of it more as a general competency check, especially for more junior talent.
Machine Learning remains the leading “discipline” by demand and its growth outpaces the overall market. Machine learning has been an in-demand skill for several years and we don’t see that changing.
REST API shows sustained, drama-free demand growth
Indexed against market growth, REST API grew by 179%, outpacing any other skill in the top 5. It also posted steadier growth than Problem Solving or Machine Learning, both of which have exhibited some month-to-month volatility.
While most languages and skills experienced a dip in mid-2022, REST API kept on chugging. There seems to be a sustained and growing demand for developers who know how to connect all the things.
Data science: so hot right now
Another bright point for 2022 has been data science and all data science-related skills.
Data Wrangling, Data Visualization, and Data Modeling are all recent additions to our assessments, and they’ve proven quite popular.
While their growth needs to be taken with a grain of salt (they are new, after all), it does indicate significant demand, and their raw numbers are enough to land all of them in the top 10.
We will be watching these skills closely over the next year to see whether this growth is a flash in the pan that will soon level out, or something poised to increase further.
Kubernetes rises, Docker falls
Even though they’re both vying toward the lower end of our skill demand rankings, it’s worth noting the divergence between Kubernetes and Docker. Over the last year, K8s surpassed Docker and grew at 185% of trend.
Docker, meanwhile, lagged behind the market and barely grew at all, with active tests only increasing by single digits. This is likely ongoing fallout from Docker’s attempt at monetization, and the growth in Kubernetes and containerization services from other providers (see: Amazon Kubernetes Service, Google Kubernetes Service, Azure Kubernetes Service, etc).
Developers seek out Problem Solving above all other skills combined
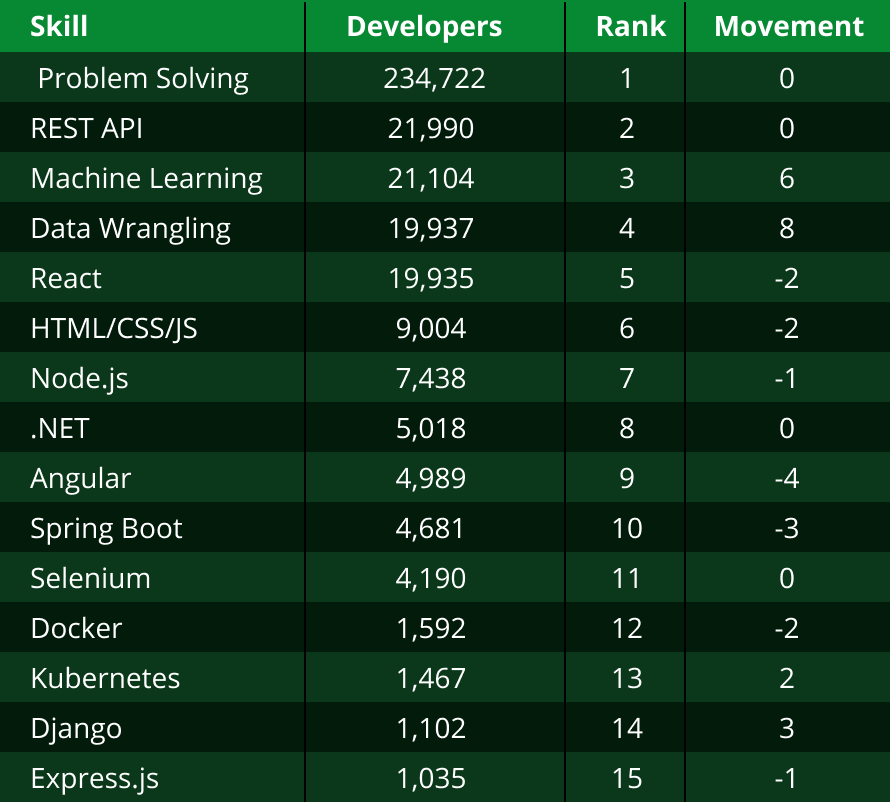
Measuring skills based on questions from our library, we find that Problem Solving remains far and away the most sought after skill. Problem Solving not only outnumbers all other skills combined, it’s nearly double the next 14 skills beneath it.
That may seem excessive, but the gap has narrowed significantly from 2021, when Problem Solving outnumbered the next 14 skills by more than 3x.
Foundational skills like Problem Solving will always rank highly, but we’re seeing more specialized skills gaining ground, and that’s reflected in year over year growth.
Employer demand for data science-related skills is taking off, and we’re seeing the same pattern among developers. Machine Learning and Data Wrangling both vaulted several ranks to take third and fourth places, respectively.
We can attribute some of the growth and the rapid rise up the ranks in 2022 to these skills being newer to the HackerRank ecosystem. But the volume speaks, well, volumes. It will be interesting to see if this growth carries into 2023.
Lower down, we found Docker and Kubernetes engaged in the pattern we’ve observed elsewhere. Both are growing, but K8s is growing much faster. In 2021, Docker boasted twice as many developers, while in 2022 that advantage is down to 10%. We expect Kubernetes to pull ahead in 2023.

2023 Skills Forecast
Looking ahead to 2023, where do we see the demand for tech skills shifting? As with our language forecast, we’re holding this forecast toward the lower end of the 95% confidence interval.
At a glance, prevailing trends will carry into 2023. Problem Solving, Machine Learning, and REST API continue to occupy the top three spots, well above the skills clustered in the longer tail. And they’re poised to open the gap even further in 2023.
Careful observers may notice that the fast-growing data science skills aren’t represented in this forecast. That’s because they’re too new to reliably forecast. As we gain additional data, we’re curious to see how these newer skills grow throughout 2023.
STATE OF THE INDUSTRY
Seeing through our growth
In the last five years, the number of unique candidates we’ve assessed has almost tripled. That doesn’t mean job interviews tripled. It just means HackerRank grew. If we want to assess the broader state of tech hiring, not just HackerRank, we need to find a way to see through our own growth.
Looking at the growth index, you can see the curves flatten out in 2020 with the pandemic, only to resume their growth in 2021. From January to December, our 12-month moving average increased 175%.
But HackerRank growth is still clouding the picture.
Tech hiring (and everything else) hit headwinds in 2022
To see past HackerRank’s growth and study the broader market, we’ve indexed test invites against their trendline. This lets us take a quick temperature check, where anything over 100 is performing above trend, and anything under 100 is below trend.
Compared to a similar index calculated from the Dow Jones Industrial Average, a general pattern emerges, from the pandemic-related slowdown in 2020 to the slip back into underindexing in 2022. This underindexing doesn’t mean a decline so much as it means slowing growth.
With all the volatility and uncertainty in the broader global economy, it’s difficult to predict what 2023 holds, but we will continue to revisit this index.
EMEA and Latin America are outpacing other regions in 2022.
While there’s been a pattern to the last two years, it has played out slightly differently across various regions. All regions saw performance fall sharply in 2020, but the North America and APAC regions experienced a shallower drop and more rapid recovery.
Latin America and EMEA both underindexed further and took longer to recover. EMEA didn’t cross the index line until late 2021.
For 2022, both regions are overindexing, while North America and APAC have been tracking right along the index line.
Data scientist candidates are most likely to take assessments
While not a perfect metric, attempt rates can be used as a loose proxy for interest or motivation. Higher assessment attempt rates indicate higher interest, more engaged candidates, and better targeting by the talent acquisition team.
When looking by role, data scientists lead with an attempt rate 8 percentage points above the average. They’re followed by software engineer interns, cloud security and cybersecurity engineers, and site reliability engineers (SREs).
The lowest attempt rates are associated full-stack engineers, data analysts, and cloud engineers.
Longer assessments are more popular
Long assessments achieved a notably higher attempt rate than either short or regular assessments. This can seem bewildering until you consider a candidate’s place in the hiring process.
A candidate being offered a longer assessment is probably further along, and therefore more engaged and willing to take an assessment.
We also found that mid- and senior-level candidates are more likely to attempt longer duration assessments than short and regular duration tests.
Test invites and attempt rates show an inverse correlation
Indexing – mapping data against its trendline – lets us compare different data sets. Basically, we can see when data points climb above or dip below their trendline. And by comparing the indexes of test invites and attempt rates, we’re seeing what looks like an inverse relationship.
When test invites overindex, (i.e. when the hiring market is hotter) we see attempt rates underindex. And when test invites underindex, we see attempt rates overindex.
When there are fewer jobs (or interviews), candidates may pursue more opportunities. Or hiring teams may be more selective.
For now, we’ll just call this correlation “interesting”. We want need to analyze more data over time to see if it holds.
Key findings
The top languages remain strong. Java, Python, and SQL are gaining popularity based on both employer demand and developer preference.
Niche languages aren’t going anywhere. Innovation moves fast, but languages can linger on almost indefinitely. Almost every language grew over the last year.
Keep an eye on Go and TypeScript. Both languages showed substantial gains in popularity in 2022. They each grew over 300% in our monthly active tests, indicating increasing demand from employers.
Data science skills are seeing surging demand. Data science-related skills like Machine Learning and Data Wrangling are gaining increasing interest from employers and developers alike. While many of these skills are too new to our platform to reliably forecast, we’re watching closely over the next year to see how they continue to grow.
REST API is a reliable, safe choice. Ranking third among Skills, REST API has exhibited steady growth since the beginning of 2021, with little of the volatility seen in other top-ranking skills.
Candidates are more likely to engage with longer tests. Developers are nearly 7 percentage points more likely to engage with longer duration assessments than with regular tests.
Overall, the tech industry continues growing. Growth has slowed down in 2022 compared to 2021, but it’s still growth, and our conservative forecast points to a recovery in 2023. Even if overall hiring slides, innovation never sleeps and companies can’t afford to fall behind in terms of tech talent.
Nothing is pulling back. The market for developer talent is incredibly competitive and even in a bear market, it’s unlikely to feel significant downward pressure. If your business is positioned for it, now is a great time to invest in tech talent.
2023 DEVELOPER SKILLS REPORT
Methodology
For the 2023 Developer Skills Report, we used exclusive data from the HackerRank platform to understand employer demand, developer preference, and candidate engagement. To estimate employer demand for specific programming languages, we looked at HackerRank Work tests where a specific programming language was required, or where specific library questions were asked. Skill demand was estimated by the number of HackerRank Work tests using specific library questions.
On the preference – or supply – side, we tracked submitted languages by candidates when they have multiple options available, as well as their proficiency in those languages. We also included HankerRank Community practice data to get a full spectrum of skill preferences.
To estimate the state of the industry, we analyzed the number of unique candidates being invited to take HackerRank tests. We also looked at attempt rates as a proxy for candidate interest or engagement.
In order to highlight trends, protect sensitive data, and compare different metrics, we have used trendlines and indexing to those trendlines.
You're viewing a limited version of this report.
Fill out the form to see all insights.
(We'll also send you a PDF copy of the report via email.)
By submitting this form, you agree to our privacy policy.
Don't worry: we'll never sell or share your data with a third party.
Skills speak louder than words
We help candidates sharpen their tech skills and pursue opportunities.
We help companies develop the strongest tech teams around.


